What Is Financial Analysis? Types, Stages, and Its Importance for Companies


Table of contents:
- What Is Financial Analysis?
- What Are the Characteristics of Financial Analysis?
- What Is the Importance of Financial Analysis?
- What Are the Objectives of Financial Analysis?
- What Is the Role of Financial Analysis in Commercial Banks?
- Is Financial Analysis Sufficient to Evaluate an Organization?
- What Are the Types of Financial Analysis?
- Other Types of Financial Analysis
- What Are the Steps of Financial Analysis?
- What Does Financial Analysis Depend On?
- What Are Financial Analysis Ratios?
- What Are the Tools Used in Financial Data Analysis?
- Accounting Financial Analysis Tools
- What Is the Difference Between Financial Analysis and Accounting Analysis?
- How Does Daftra Help You with Financial Analysis Processes?
- Frequently Asked Questions
If you want to invest your money in a company, the first step you should take is to conduct a financial analysis of that company’s financial statements. This helps reduce the risks associated with the investment process and enables you to anticipate a satisfactory return.
Companies rely on the results of financial analysis when making partnership decisions and other investment-related decisions. Within this context, we explain the concept of financial analysis from the perspective of our accounting expertise, and we review its importance, objectives, types, and ratios.
We also explain the steps for conducting it and the tools that help the financial analyst carry out their task and achieve optimal results from the analysis.
What Is Financial Analysis?
Financial analysis is the process of evaluating businesses, projects, and budgets from a financial perspective. Financial analysis is a highly important tool for guiding decision-makers toward better, more profitable financial performance.
Financial analysis for companies may be conducted to evaluate performance, exercise control, and prepare plans; to conduct investment financial analysis aimed at identifying the most suitable investment opportunities; or to analyze the state and its governmental bodies, or any other entity.
What Are the Characteristics of Financial Analysis?
There is a set of fundamental characteristics that financial analysis must possess in order to help companies form a comprehensive and realistic view of their performance and financial position. Accordingly, we answer the question “What are the basics of financial analysis?” in clear and concise points:
- Accuracy: The analysis must be accurate and based on reliable data.
- Comprehensiveness: The analysis should cover all key financial aspects of the entity.
- Up-to-dateness: The analysis must be current and reflect the current financial situation.
- Objectivity: The analysis must be objective and unbiased.
- In-depth understanding: The analysis should provide a deep understanding of financial performance and capabilities.
What Is the Importance of Financial Analysis?
In the age of information and investment in which we live, financial analysis is of great importance because it contributes to achieving financial and managerial success for institutions and individuals alike. Below are the reasons that highlight the benefits of financial analysis according to the parties that use it:
1- Investors
Investors use the results of financial analysis to evaluate company performance and make investment decisions such as buying or selling shares.
2- Lenders
Such as banks and financial institutions, which rely on financial analysis results to assess a company’s financial health and creditworthiness and identify potential risks.
3- Management
Management uses the results of financial analysis to evaluate internal performance and make strategic decisions to improve efficiency, profitability, and financial performance.
4- Customers
Customers use financial analysis results to assess a company’s financial stability, especially for long-term contracts or partnerships.
5- Government Entities
Government officials use the results of companies’ financial analysis to obtain comprehensive insights into the overall condition of the local economy, identify the most active sectors and fields that contribute the largest share of tax revenues, and enhance public–private partnerships to support infrastructure and development projects.
What Are the Objectives of Financial Analysis?
Some may wonder about the uses of financial analysis. The answer is that these uses vary according to the purposes of financial analysis an organization seeks to achieve to enhance the effectiveness of strategic decisions that contribute to financial stability. Among the most important objectives of financial analysis are:
1- Determining the Company’s Financial Efficiency
Current and quick liquidity ratios, as tools of financial analysis, help measure the company’s ability to meet its short-term obligations and evaluate its efficiency in managing available liquidity.
2- Assessing Financial Health
By analyzing financial indicators, it is possible to assess the company’s financial health and its ability to meet its obligations, as well as its creditworthiness. Profitability ratios, such as profit margin and return on assets, also indicate the extent of the company’s success in generating profits and its efficiency in allocating and distributing its resources.
3- Supporting the Financial Planning Process
Financial analysis helps evaluate financial performance by identifying the organization’s strengths and weaknesses. Accordingly, management can develop strategies to improve financial planning that enhance strengths and address weaknesses, thereby strengthening the company’s competitiveness and financial sustainability.
4- Evaluating the Company’s Managerial Efficiency
Financial analysis provides accurate indicators of the success of relevant departments such as purchasing and sales through activity ratio indicators, thereby supporting financial management and senior management in setting their short- and long-term objectives.
5- Enhancing Transparency and Credibility
Financial analysis provides clear information that helps build trust among the company, investors, lenders, and all stakeholders. It also helps companies identify available investment opportunities in the business market.
6- Assessing Market Value
Financial analysis helps estimate a company's fair value by calculating the value of expected cash flows over a specified period or by using the price-to-earnings (P/E) ratio to evaluate companies, facilitating acquisition processes and strengthening strategic partnerships.
7- Determining the Company’s Financial Position
One of the main objectives of financial analysis is to determine the organization's financial position in terms of its ability to obtain financing and loans, and to repay them, as well as to evaluate the success of financial management and senior management in maintaining a stable financial position.
What Is the Role of Financial Analysis in Commercial Banks?
The role of financial analysis appears in improving operational efficiency, effectively managing risks in the banking sector and commercial banks, and providing documented information to support decision-makers. Below are the main roles of financial analysis in banking operations:
- Credit Evaluation: Financial analysis is used to assess customers’ (individuals or companies) ability to repay loans.
- Risk Management: Financial analysis helps banks identify and manage financial risks, including market, credit, and liquidity risks.
- Investment Decision-Making: It is used to evaluate investment opportunities and make informed decisions regarding asset allocation and investments.
- Planning and Forecasting: It supports financial planning and forecasting of future trends, helping banks determine their financial and operational strategies.
- Regulatory Compliance: Financial analysis ensures that the bank complies with regulatory standards and financial requirements.
- Pricing Financial Services: Financial analysis is used to determine interest rates and fees charged by commercial banks for providing various financial services, such as savings accounts, current accounts, loans, credit cards, stocks, bonds, investment funds, and online banking services.
Use our free investment calculator to find out the return on investments.
Is Financial Analysis Sufficient to Evaluate an Organization?
No, because financial analysis alone may not be sufficient to comprehensively evaluate an organization. Therefore, it should be used in conjunction with other analytical tools to obtain a complete and accurate picture of the organization. The most prominent of these tools include:
- Strategic analysis, which provides an understanding of the organization’s vision, mission, and overall strategies.
- Operational analysis, through which the efficiency of daily operations and productivity can be evaluated.
- Human resources evaluation helps understand how talent and human resources are managed within the organization.
- Market and industry analysis, which helps evaluate the organization’s market position and the challenges and opportunities in the industry in which it operates.
- Technological analysis, through which it is possible to understand how technology is used in operations, products, or services.
- Environmental and social analysis is used to assess the organization’s impact on the environment and society.
What Are the Types of Financial Analysis?
This classification can be specified by answering the question: What are the criteria of financial analysis? These criteria determine the types of financial analysis through which financial strategies can be improved and organizational objectives achieved in a manner that suits the organization's size and the nature of its business activities.
Below are the most important financial analysis factors:
1- Financial Analysis According to the Movement Factor
- Vertical Financial Analysis
Vertical financial analysis involves analyzing related ratios in the financial statements over a specific time period, such as the ratio of short-term current assets to total assets for 2022, without comparing the data and results of this period with those of other periods in the financial statements.
- Horizontal Financial Analysis
Horizontal analysis, on the other hand, involves analyzing a specific item or a group of items in the financial statements against their counterparts in different time periods, such as comparing the liquidity ratio in 2021 with that in 2022 for the same company.
2- Financial Analysis According to the Time Factor
- Short-Term Financial Analysis
This type of financial analysis focuses on assessing and measuring short-term financial performance and decision-making, such as determining the liquidity ratio and the company’s ability to meet near-term obligations.
- Long-Term Financial Analysis
In contrast to short-term analysis, long-term financial analysis focuses on performance and data related to long-term operations and decisions, such as the company’s ability to generate profits and bear the cost of interest on loans or external financing.
3- Financial Analysis According to the Executing Party
- Internal Financial Analysis
This type is characterized by full access to financial data. It is the analysis conducted by the company using its own personnel to support decision-making, evaluate performance, and explore available improvement opportunities.
- External Financial Analysis
In contrast to internal analysis, this type lacks full access to financial data. It is the analysis conducted by individuals or entities external to the company and is often carried out to identify available investment opportunities within the company.
4- Financial Analysis According to Financial Ratios
Financial ratios include the following:
- Liquidity ratios
- Activity ratios
- Profitability ratios
- Leverage (debt) ratios
- Market ratios
Each ratio will be explained in some detail later under the heading “Financial Analysis Ratios.”
Other Types of Financial Analysis
As mentioned in the previous sections, financial analysis types can be classified according to several factors. In addition to these classifications, there are other types of financial analysis, such as:
1- Comparative Financial Analysis
Comparative financial analysis compares a company’s performance with that of other companies in the same industry or with general, standardized industry benchmarks for a specific field. This analysis aims to identify the company’s strengths and weaknesses relative to competitors and determine areas for improvement.
2- Trend Analysis
It is somewhat similar to comparative financial analysis in that it also focuses on comparisons, but within the context of tracking the company’s financial data over multiple time periods, such as comparing revenues, expenses, and profits over 5 years.
The main objective of this type of financial analysis is to assess the stability of financial performance.
3- Cash Flow Analysis
Cash flow financial analysis is the process of evaluating cash inflows and outflows from operating, investing, and financing activities over a specified period.
This type of financial analysis aims to understand and evaluate how the company manages its cash and how this affects liquidity ratios and financial performance. Cash flow analysis also helps in future financial planning and strategic decision-making.
4- Risk Analysis
This type of financial analysis includes:
1- Identifying Potential Internal Financial Risks
Internal financial risks include the inability to manage cash flows effectively, leading to liquidity shortages; excessive reliance on borrowing for financing, resulting in debt repayment problems and high leverage ratios; and the inability to control costs, which negatively affects profitability ratios.
ِAs well as risks associated with accounting errors, such as mistakes in recording or preparing financial reports, leading to misleading results and, consequently, incorrect decisions; and the lack of operational efficiency, which results in weak internal operations and, in turn, affects overall performance and profitability.
2- Identifying Potential External Financial Risks
External financial risks include market fluctuations and changes in the prices of goods or services; economic conditions such as recession or inflation, which can affect the supply and demand for products and services; political risks such as changes in government policies or political instability in the country; intense competition that can affect the company’s market share; and changes in exchange rates, especially for companies that rely on transactions in foreign currencies.
Objective of Financial Risk Analysis
- Facilitating planning to address external or internal financial risks the organization may face, and ensuring business sustainability.
- Assessing the impact of risks on financial performance and operational processes, and then determining treatment priorities.
- Developing strategies to mitigate the impact of financial risks, such as controlling costs, improving operational procedures, or diversifying revenue sources.
What Are the Steps of Financial Analysis?
The stages and steps of financial analysis may differ from one analyst to another, depending on the analysis's objective, available resources, the approach each analyst follows, and the cases they work on. However, it is possible to establish general frameworks that clarify how financial analysis is conducted.
1- Defining the Objectives of the Analysis
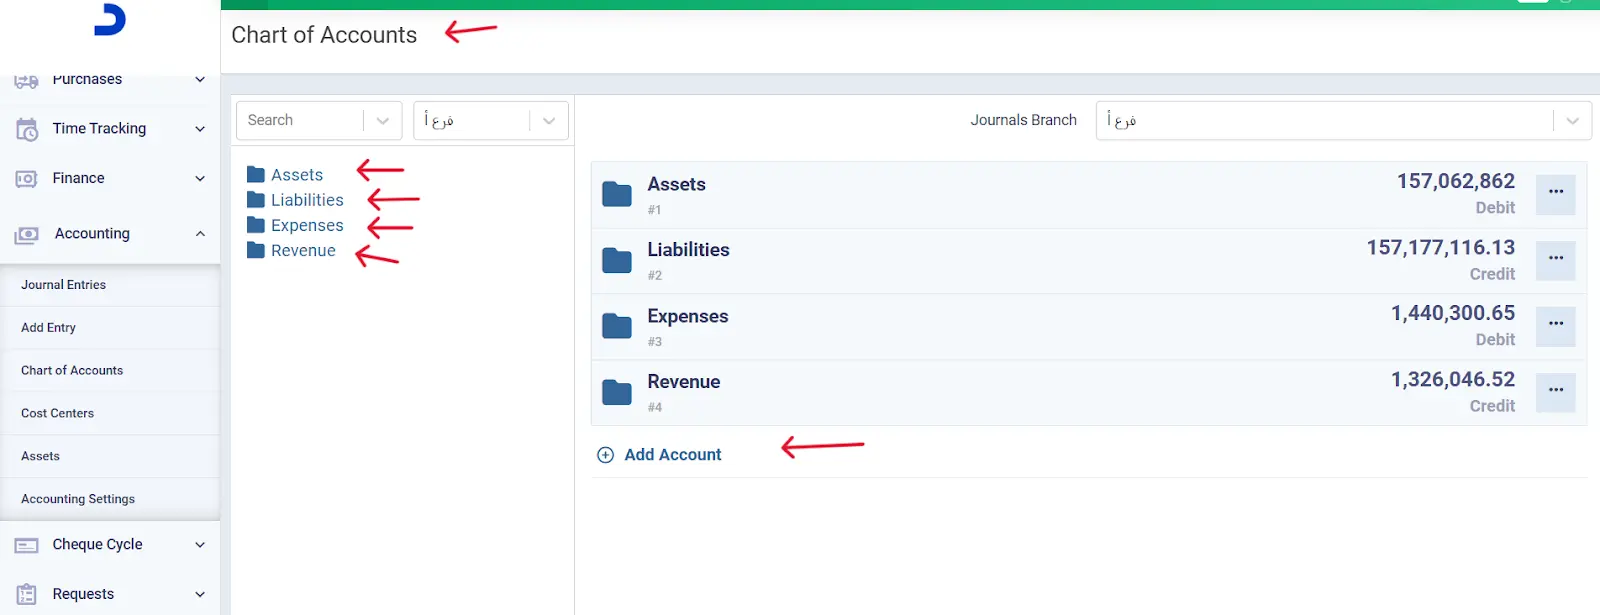
It is essential to determine the objective of the financial analysis before starting, to direct the focus to relevant financial data and exclude data that does not support the analysis's purpose. All the financial data required for analysis can be easily and accurately obtained through the Chart of Accounts program in Daftra.
Defining the objective also helps select the most appropriate tools and methods for analysis and produce results that support the beneficiary and the decision-maker.
2- Defining the Time Horizon of Financial Analysis
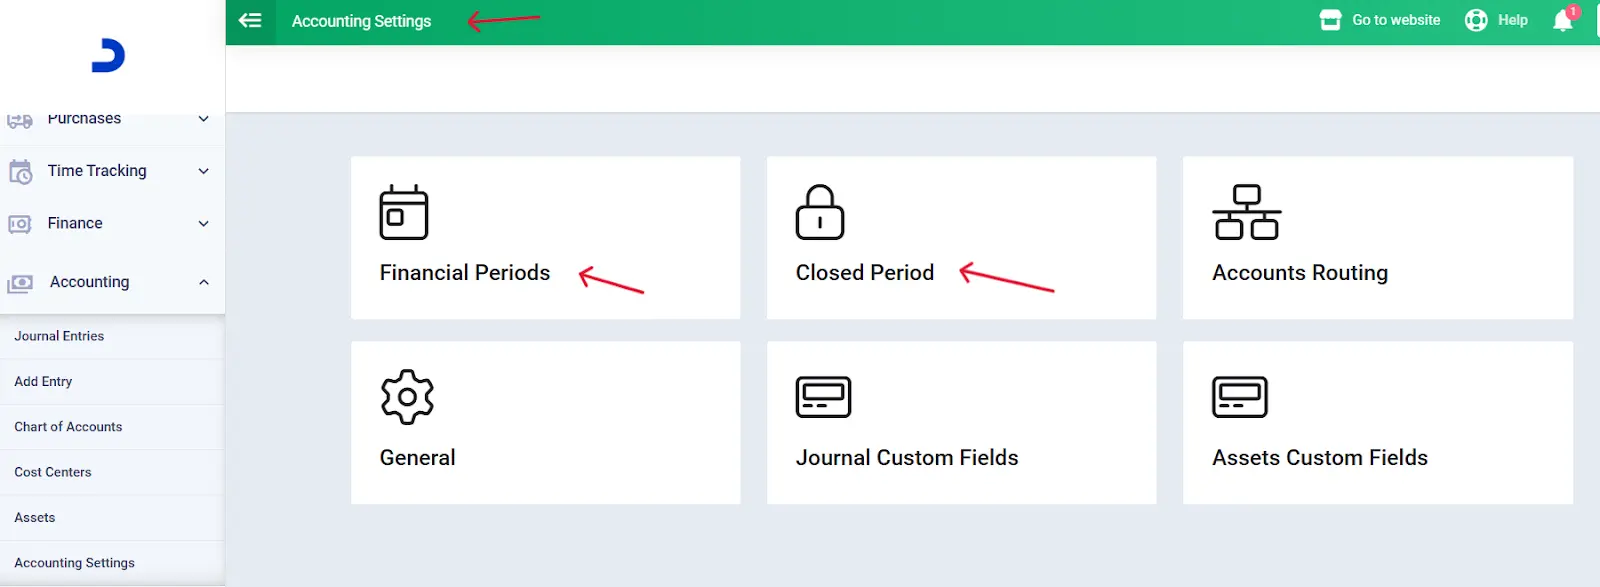
A time limit for the financial periods to be included in the analysis should be set. To obtain accurate results from financial analysis, it is preferable to include multiple financial periods, as a single period may not accurately reflect the financial position.
The General Chart of Accounts in Daftra provides smart solutions for executing the stages of financial analysis with accuracy and speed, such as defining financial periods and comparing the results of different financial periods in order to obtain accurate financial analysis results.
3- Collecting the Required Financial Information and Data from Their Sources
This involves identifying the financial data needed to conduct the analysis, such as financial statements, inventory movements, and expenses.
Daftra helps collect financial information on assets, liabilities, cash flows, revenues, and expenses in the least time and effort by clicking the general ledger reports on the system’s dashboard. This provides the financial analyst with information that helps produce accurate results.
4- Determining the Method and Tools of Financial Analysis
After defining the objective, time horizon, and collecting the required data, the method of financial analysis and the appropriate tools for conducting the analysis are determined.
5- Conducting the Analysis Using the Selected Methods and Tools
The most important step is conducting the analysis by processing the collected financial data according to the selected methods and tools.
At this stage, the factors of skill and experience become evident, distinguishing one financial analyst from another, as this step requires proficiency in transforming financial data into useful information and indicators for evaluating the financial position and making decisions.
6- Reaching Conclusions and Presenting Recommendations
After completing the previous stages, the financial analyst can arrive at clear, accurate results that explain the financial position. Based on these results, recommendations are presented for the analyst's consideration to answer the questions raised prior to the analysis and achieve its objectives.
What Does Financial Analysis Depend On?
Financial analysis depends on the accuracy and quality of available financial data, the knowledge, experience, and skills of the financial analyst, and the analytical tools, techniques, and financial models used in the analysis.
It is also influenced by general economic conditions and the market environment and depends on the accounting standards, regulatory laws, and regulations applied.
What Are Financial Analysis Ratios?
The financial ratios used in financial analysis are many and varied, depending on the analysis's objective and the nature of the entity being analyzed. The main financial ratios can be divided into the following groups:
Group One: Liquidity Ratios
1- Current Ratio
This ratio shows the extent to which current assets cover current liabilities. The optimal current ratio is (2), because the higher the ratio, the more it indicates a large volume of underutilized current assets. Note that the result of the equation is not calculated as a percentage, but in terms, meaning how many times current assets can cover current liabilities.
This ratio can be expressed by the following equation:
Current Ratio = Current Assets ÷ Current Liabilities
2- Short-Term Liquidity Ratio
This ratio indicates the company’s ability to pay its short-term debts, such as supplier expenses. The short-term liquidity ratio is calculated using the following equation:
Short-Term Liquidity Ratio = (Current Assets − Prepaid Expenses) ÷ Current Liabilities
Any other asset that management considers slow to convert into cash is also deducted from current assets, with inventory being the most common asset excluded.
3- Cash Ratio
In this ratio, only cash is calculated from current assets, as it is the most liquid. The cash ratio is calculated using the following equation:
Cash Ratio = (Cash + Short-Term Investments) ÷ Current Liabilities
4- Working Capital
Working capital is a type of capital and is a very important indicator of an organization’s short-term financial efficiency. Working capital is calculated using the following equation:
Working Capital = Current Assets − Current Liabilities
Group Two: Activity Ratios
1- Accounts Receivable Turnover:
This ratio determines the number of times accounts receivable are collected during the period. It is calculated using the following equation:
Accounts Receivable Turnover = Net Credit Sales ÷ Average Accounts Receivable
2- Average Collection Period:
This ratio represents the collection period of receivables; therefore, the lower it is, the better the company’s financial performance. It can be calculated using the following equation:
Average Collection Period = (Average Accounts Receivable × 365) ÷ Net Credit Sales
3- Inventory Turnover:
Inventory turnover measures the rate at which inventory is sold, indicating that items are being sold. Therefore, the higher the ratio, the better. Inventory turnover is calculated using the following equation:
Inventory Turnover = Cost of Goods Sold ÷ Average Inventory
Group Three: Profitability Ratios
1- Gross Profit Margin:
This ratio shows gross profit relative to net sales; therefore, the higher it is, the better. It can be calculated using the following equation:
Gross Profit Margin = Gross Profit ÷ Net Sales
2- Net Profit Margin:
This ratio shows net profit relative to net sales; therefore, the higher it is, the better. It can be calculated using the following equation:
Net Profit Margin = Net Profit ÷ Net Sales
3- Return on Assets (ROA):
Return on assets shows the organization’s ability to generate profits from its assets and reflects the efficiency of asset utilization. Therefore, the higher the ratio, the better. It can be calculated using the following equation:
Return on Assets = Net Profit ÷ Average Total Assets
Group Four: Leverage Ratios
1- Debt Ratio:
The debt ratio is the primary ratio used to assess the risk of investing in the company. The lower this ratio, the better. It can be calculated using the following equation:
Debt Ratio = Total Debt (Short-Term and Long-Term) ÷ Total Assets
2- Debt-to-Equity Ratio:
This ratio is also an important risk indicator, as it shows the relationship between an organization's debt and the organization's equity. It can be calculated using the following equation:
Debt-to-Equity Ratio = Total Debt ÷ Equity
3- Interest Coverage Ratio:
This ratio indicates the company’s ability to pay its interest obligations. The higher the ratio, the better for the company. It can be calculated using the following equation:
Interest Coverage Ratio = Earnings Before Interest and Taxes ÷ Interest Expense
Group Five: Market Ratios
1- Earnings per Share (EPS):
This ratio shows the share of ordinary stock in income during the financial period, which is a highly important indicator for investment purposes. EPS can be calculated using the following equation:
Earnings per Share = (Net Profit − Preferred Dividends) ÷ Average Number of Ordinary Shares
2- Price-to-Earnings Ratio (P/E):
This ratio links earnings per share with its market value. A higher ratio indicates the company’s competitive advantage and its potential to generate profits. It can be calculated using the following equation:
Price-to-Earnings Ratio = Market Price per Share ÷ Earnings per Share
3- Price-to-Book Value Ratio:
This ratio compares two elements: the market price of the share and its book value. The first reflects the company’s future cash flows, while the second reflects the historical profits or losses of the shares under the historical cost principle. It can be calculated using the following equation:
Price-to-Book Value Ratio = Share Price ÷ Book Value per Share
What Are the Tools Used in Financial Data Analysis?
Financial analysis tools play a vital role in collecting and analyzing financial data and deriving results in a practical and effective manner, making the financial analyst’s job easier and more accurate. Below are the most prominent tools and technical programs that can be used in financial analysis:
1- Microsoft Excel
Microsoft Excel is considered one of the most important and widely used programs in financial analysis. It is characterized by flexibility and wide availability, with the ability to format, organize, and process data in spreadsheets. Accordingly, it enables data analysts to easily extract statistics and results and present them in charts and graphs.
2- PitchBook Data
The PitchBook Data tool, which specializes in data collection and market analysis, includes a suite of advanced analytical tools that help financial analysts extract information and provide clear insights into financial performance, especially regarding investment opportunities.
3- Causal
Causal is considered an ideal tool for collecting, classifying, and analyzing data in tables, with diverse presentation capabilities that make understanding and interpreting results easier and more interactive. Thus, it significantly supports the financial analyst in performing their tasks effectively.
4- Tableau
Tableau is a specialized data analysis tool that enables financial analysts to develop a clear view of large datasets by studying and analyzing them. This tool also supports interactive visualization and displays results in tables and charts, facilitating reading and presentation.
Although all these tools and other data analysis and collection tools are excellent means for financial analysts, Microsoft Excel stands out from others due to its wide availability and ease of use, along with the availability of learning resources that explain how to use it, which is reflected in its widespread adoption among analysts and other users.
Accounting Financial Analysis Tools
Accounting financial analysis tools focus on a comprehensive evaluation of the financial position through various ratios and analyses, as follows:
1- Financial Models
Financial analysis models are used to analyze scenarios and forecasts. Types of financial models include:
- Relative valuation model: Relies on comparing the company’s value with similar companies in the sector by using financial indicators such as the price-to-earnings (P/E) ratio and the price-to-book (P/B) ratio to determine the company’s fair value based on market valuation.
- Discounted cash flow (DCF) model: Used to estimate the company’s value based on projections of future cash flows.
- Profitability model: Focuses on analyzing profit margins and returns to determine the company’s efficiency in generating profits.
- Balance sheet model: Shows the company’s financial position at a specific point in time by presenting assets, liabilities, and equity.
- Forecasting model: Used to predict the company’s future financial performance, such as forecasting revenues, expenses, and profits based on historical data and trend analysis.
- Pricing model: Focuses on determining the fair price of financial assets or goods while maintaining appropriate profit, and relies on economic and financial factors and market competition.
- Sum-of-the-parts model: Used to evaluate parent companies that include subsidiaries, where each company is evaluated separately, and the values are then aggregated to obtain the company’s total value.
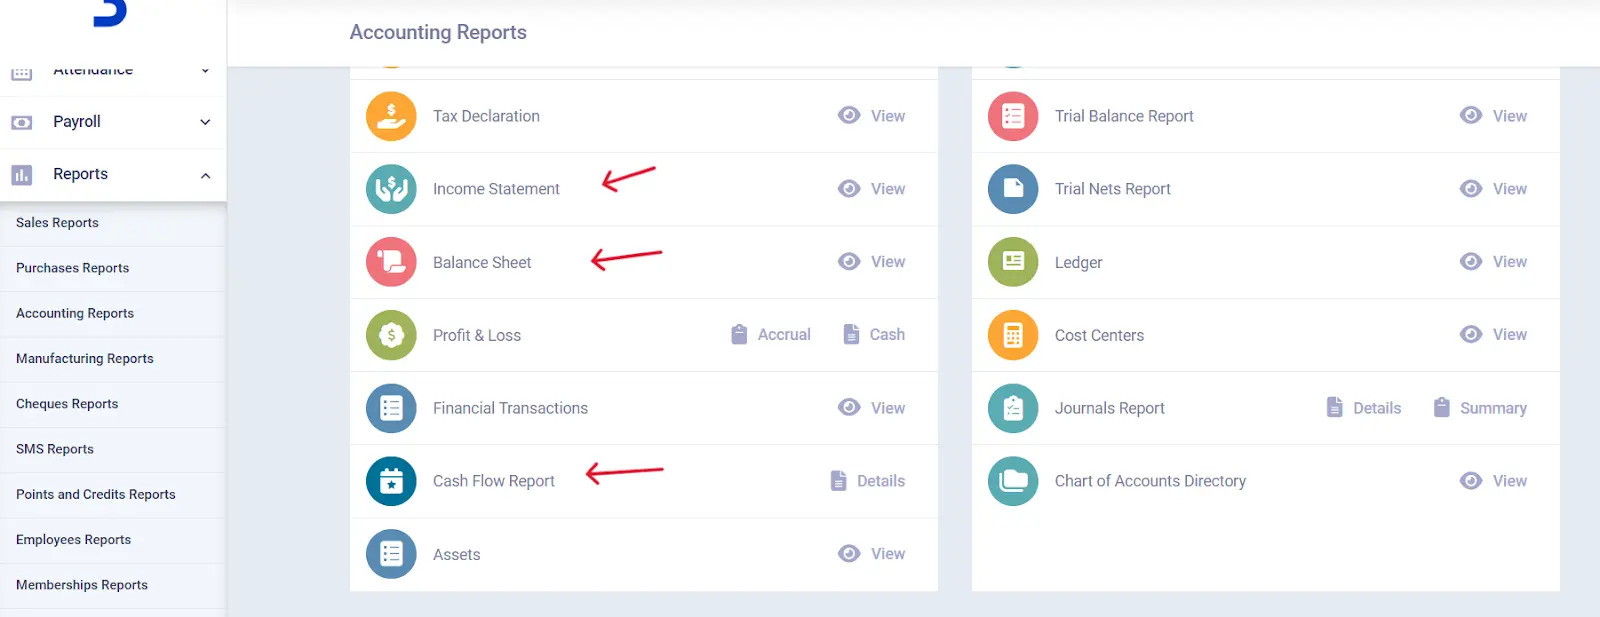
2- Financial Reports
These include balance sheet reports and income statement reports, which provide comprehensive information about the financial position and performance.
3- Financial Performance Indicators
Such as compound annual growth rate (CAGR), gross profit margin, net profit margin, return on assets, return on equity, revenue variance analysis indicators, and other indicators.
Use Daftra's free compound return calculator to automatically analyze the return on your investments.
What Is the Difference Between Financial Analysis and Accounting Analysis?
The difference between financial analysis and accounting analysis can be identified by considering the following factors:
1- Focus
Financial analysis focuses on evaluating a company's overall financial performance. It includes analyzing financial statements, evaluating assets and liabilities, and analyzing financial ratios to provide a comprehensive view of the company’s financial position and future trends.
Accounting analysis, on the other hand, focuses on recording, classifying, and summarizing financial events systematically and is concerned with the accuracy of presenting financial data in accordance with accounting standards.
2- Purpose
Financial analysis is used to make investment, financing, and operational decisions and aims to provide recommendations and strategies to improve financial performance. Accounting analysis aims to ensure accuracy and compliance with accounting standards and provides a foundation for financial analysis.
3- Tools and Techniques
Financial analysis relies on financial ratios, horizontal and vertical analysis, and financial valuation models. In contrast, accounting analysis relies on accounting principles, financial reporting standards, and auditing techniques.
How Does Daftra Help You with Financial Analysis Processes?
Daftra’s accounting software provides you with financial data, statements, and reports that help you perform financial analysis in accordance with the accounting system used in your organization, in a simple and accurate manner.
Frequently Asked Questions
How Do I Start a Career in Financial Analysis?
You can start in the field of financial analysis by following these steps:
- Obtaining a university degree in finance, business, economics, accounting, or related fields.
- Considering obtaining training courses and professional certifications such as the CFA and CPA, as these certifications enhance accounting skills and expertise, and help secure better opportunities.
- Learning how to analyze financial statements and understand financial ratios and other indicators.
- Developing the ability to work with numbers and use statistical tools.
- Gaining proficiency in programs such as Microsoft Excel and specialized financial analysis software such as Daftra.
- Searching for internship opportunities in banks, investment companies, or financial firms.
- Starting by analyzing the financial statements of public companies as a personal project.
- Keeping up with financial news, financial markets, and economic developments.
- Joining professional organizations, such as local or international financial associations.
- Networking with professionals in the field by attending professional events and participating in forums and groups related to financial analysis.
- Pursuing continuous learning through research and reading books and articles related to financial analysis and economics.
Who Is Responsible for Financial Analysis?
The financial analyst (Financial Analyst) is responsible for conducting financial analysis and providing recommendations to improve the financial performance of organizations.
Thus, we have concluded by presenting a comprehensive overview of financial analysis, after reviewing its concept and importance, outlining its objectives, types, and ratios, and explaining the steps for conducting financial analysis and the tools that financial analysts can rely on for this purpose.