
Financial ratios in financial analysis and how to calculate them


Table of contents:
- Concept of Financial Ratios
- Who benefits from financial ratios?
- What are the types of financial ratios, and how are each calculated?
- How are financial ratios used?
- What are the Advantages and Disadvantages of Financial Ratio Analysis?
- How does Daftra help you calculate financial ratios?
- Frequently Asked Questions
- Conclusion
What determines the financial health of companies and evaluates their ability to manage their resources and meet their obligations? The simple answer is financial ratios, which serve as a compass, guiding investors and business owners in making the right decisions. Financial ratios are the foundation of financial analysis, based on accurate financial data and information.
In this context, in the following lines of the article, we present a summary of our accounting expertise in explaining financial ratios, their types, and how to use them, which ultimately helps you better understand the performance and financial position of your organization and identify strengths and weaknesses to implement corrective and improvement measures necessary to maintain growth and financial sustainability.
Concept of Financial Ratios
Financial ratios are a common and important tool primarily used in financial analysis. The analysis process using financial ratios involves comparing two elements from financial data or statements and reaching a conclusion. These results inform decision-making and analysis of the current situation, and they indicate whether the company will continue or may close soon.
Who benefits from financial ratios?
Financial ratios are an important analytical tool that serves multiple stakeholders inside and outside the organization, each using them for a different purpose. These are the parties that benefit from financial ratios:
1- Company Management
They use ratio comparisons to analyze the company’s performance and make judgments about it.
2- Investors
Investors need guarantees or at least evidence that their investments are in the right place. Ratios play a key role in financial analysis, enabling investors to predict investment outcomes and assess risk and safety.
3- Lenders
Before lending to the company, whether from banks or any other lenders, there is a need for repayment guarantees or at least assurance of the company’s future ability to repay. Financial analysis using ratios provides evidence of whether the company can repay its loans in the future or sooner.
It becomes clear that the beneficiaries of financial ratios are: company management, which uses the ratios to evaluate performance and make strategic decisions; investors, who rely on the results to estimate expected returns and investment risks; and lenders, who use them as a means to measure the company’s ability to meet its financial obligations.
What are the types of financial ratios, and how are each calculated?
Financial ratios are among the most important tools in financial analysis, enabling analysts, investors, and company management to assess an organization's financial performance and efficiency. Each ratio has a different purpose, and there are 5 types of financial ratios used for financial analysis:
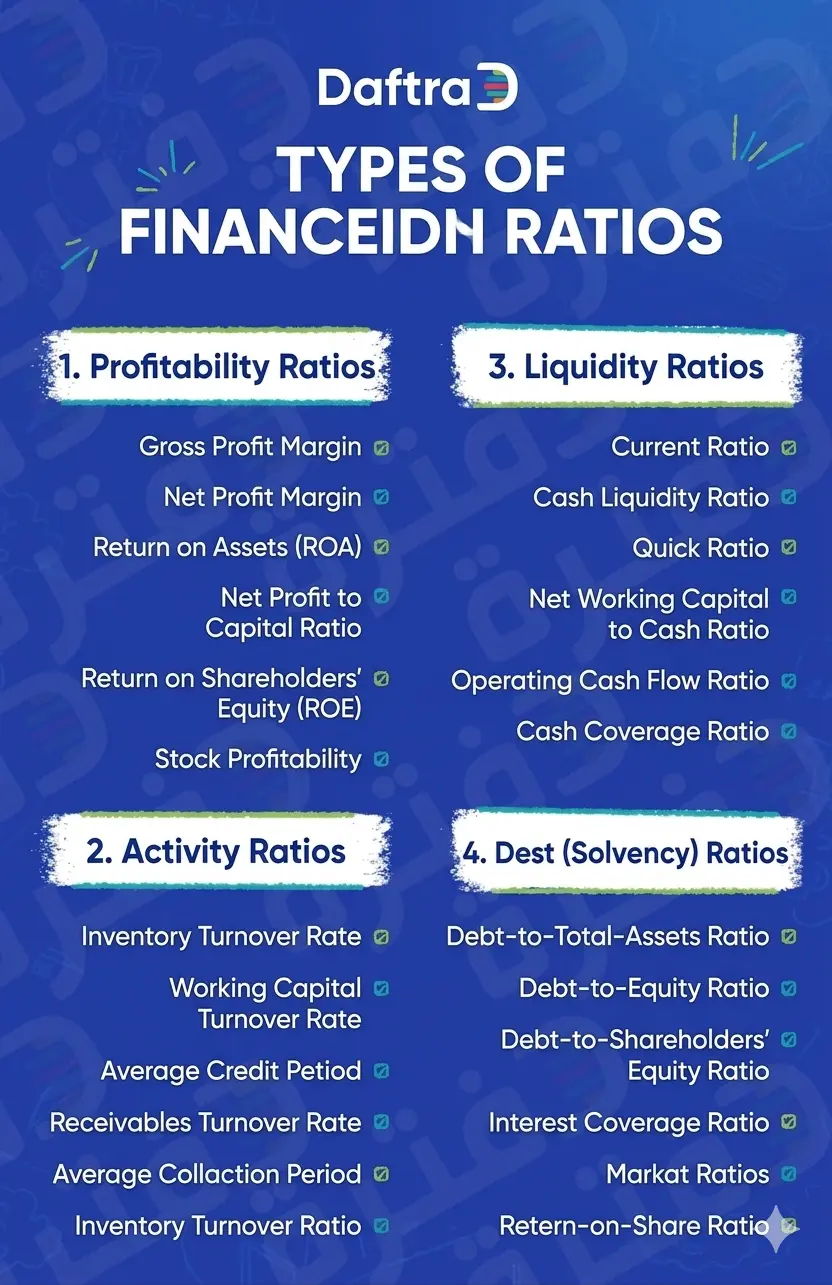
1- Liquidity Ratios
Liquidity ratios determine the company’s ability to meet its obligations from current liabilities through the current assets it owns.
There are several ratios to measure liquidity:
A- Current Ratio
How to calculate the ratio: Current Assets / Current Liabilities
The current ratio measures a company’s ability to meet current obligations with current assets. Therefore, an increase in this ratio indicates the company’s strong financial position. The higher the current ratio, the greater investors' confidence in the company's ability to weather any crises or challenges it may face.
The standard current ratio is 1:2; a higher ratio indicates inefficiency in the company’s use and investment of its funds.
B- Cash Liquidity Ratio
How to calculate the ratio: Cash and cash equivalents / Current liabilities
The cash liquidity ratio indicates the extent to which the company can pay its current obligations through cash and near-cash assets, meaning it shows whether reliance on cash is possible or not, but excluding the company’s debts and inventory. The standard cash liquidity ratio is 1:1, though it can be slightly lower.
C- Quick Ratio (Acid-Test Ratio)
How to calculate the ratio: (Current Assets – Inventory) / (Prepaid Expenses – Current Liabilities)
The quick ratio indicates the company’s ability to meet current obligations using quick assets. The standard quick ratio is 1:1.
D- Net Working Capital Ratio
How to calculate the ratio: Current Assets – Current Liabilities
The net working capital ratio indicates the extent to which the company can finance its daily current obligations and whether it is capable of doing so or not. The result indicates the efficiency or inefficiency of the company’s management. The higher the net working capital ratio, the more successful the company is; if it decreases, the company may be unable to finance its obligations.
E- Operating Cash Flow Ratio
How to calculate the ratio: Cash Flow from Operating Activities / Current Liabilities
The operating cash flow ratio indicates the ability to meet current obligations through cash generated from operating activities. A high value of this ratio is a good sign of the company’s strength, while a low value indicates the company’s inability to pay its obligations.
F- Cash Coverage Ratio
How to calculate the ratio: (Current Assets – Inventory – Prepaid Expenses) / (Daily Operating Expenses)
The cash coverage ratio indicates the time period during which the company can finance its potential daily operating obligations using the cash it owns.
2- Profitability Ratios
These ratios indicate the profits the company has earned from its activities and projects. Investors and lenders are particularly interested in these ratios.
There are several ratios to measure a company’s profitability:
A- Gross Profit Ratio
How to calculate the ratio: Gross Profit / Sales
The gross profit ratio indicates the company’s efficiency in managing sales-related costs.
B- Net Profit Ratio
How to calculate the ratio: Net Profit / Net Sales
The net profit ratio indicates the profit the company earned relative to sales and its ability to control expenses.
You can use our free margin calculator to find out the value of gross profit, net profit, or operating profit.
C- Return on Assets (ROA)
How to calculate the ratio: Net Profit / Average Assets
The return on assets ratio measures the profit earned on a company’s assets and indicates whether the company is efficiently using them to generate profits.
D- Net Profit on Capital Ratio
How to calculate the ratio: Net Profit / Working Capital
The net profit on capital ratio indicates the profit earned from working capital.
E- Return on Shareholders’ Equity (ROE)
How to calculate the ratio: Net Profit / Average Shareholders’ Equity
The return on shareholders’ equity ratio indicates the company’s ability to generate profits from shareholders’ funds.
F- Earnings Per Share (EPS) Ratio
How to calculate the ratio: Net Profit / Average Number of Outstanding Shares
The earnings per share ratio indicates the amount of profit per share.
3- Activity (Efficiency) Ratios
Activity ratios focus on the allocation of cash across different assets and indicate the company’s ability and efficiency in managing its resources, as reflected in its non-monetary current assets, such as inventory, and converting them into cash through sales. Managers and shareholders are particularly interested in this type of ratio.
There are several ratios to measure a company’s activity:
A- Asset Turnover Ratio
How to calculate the ratio: Net Sales / Average Total Assets
The asset turnover ratio indicates the company’s ability to generate and increase sales through the use of its assets.
B- Working Capital Turnover Ratio
How to calculate the ratio: Net Sales / Average Working Capital
The working capital turnover ratio measures the company’s ability to generate and grow sales using its working capital.
C- Average Credit Period
How to calculate the ratio: 365 / Working Capital Turnover
The average credit period ratio indicates the time required to collect credit.
D- Accounts Receivable Turnover Ratio
How to calculate the ratio: Net Credit Sales / Average Accounts Receivable
The accounts receivable turnover ratio measures a company’s efficiency in collecting accounts receivable and converting them into cash over a given period.
E- Average Collection Period
How to calculate the ratio: 365 / Accounts Receivable Turnover
The average collection period ratio indicates the time period required to collect accounts receivable.
F- Inventory Turnover Ratio
How to calculate the ratio:Cost of Goods Sold / Average Inventory
The inventory turnover ratio measures how many times a company sells and replaces its inventory.
Read in detail about the inventory turnover formula and how to calculate it
G- Average Inventory Holding Period
How to calculate the ratio: 365 / Inventory Turnover
The average inventory holding period ratio indicates the time required to sell the inventory.
H- Operating Cycle
How to calculate the ratio: Average Collection Period + Average Inventory Holding Period
The operating cycle ratio indicates the time required to complete a full operating cycle.
I- Cash Cycle
How to calculate the ratio: Operating Cycle – Average Credit Period
The cash cycle ratio indicates the time required to complete the net cash cycle.
Here’s the translation of your text without changing it:
4- Debt (Leverage) Ratios
Debt ratios determine the extent to which a company relies on its debts to finance its assets, and thus indicate whether this reliance poses a risk or negatively affects the company’s future, in addition to identifying the source of financing.
Increasing reliance on debt to finance the company’s obligations exposes it to risk due to the burden of higher borrowing.
Both owners and lenders pay special attention to debt ratios.
There are several ratios to measure debt:
A- Debt to Total Assets Ratio
How to calculate the ratio: Total Debt / Total Assets
The debt-to-total assets ratio indicates the proportion of assets financed by debt.
B- Debt to Equity Ratio
How to calculate the ratio: Total Debt / Equity
The debt-to-equity ratio indicates the proportion of capital and retained earnings used to finance the company’s assets and obligations.
C- Debt to Shareholders’ Equity Ratio
How to calculate the ratio: Total Debt / Total Shareholders’ Equity
The debt to shareholders’ equity ratio indicates the proportion of loans contributing to financing the assets.
D- Interest Coverage Ratio
How to calculate the ratio: Earnings Before Interest and Taxes (EBIT) / Total Interest Expense
The interest coverage ratio indicates the company’s ability to meet interest payments on time.
5- Market Ratios
Market ratios are used to infer the market’s evaluation of the company’s performance and position.
There are several ratios to measure market performance:
A- Earnings Per Share (EPS) Ratio
How to calculate the ratio: Net Profit / Average Number of Common Shares Outstanding During the Year
The earnings per share ratio measures the net profit per share of outstanding stock at the end of the period.
B- Price-to-Earnings (P/E) Ratio
How to calculate the ratio: Market Price per Share / Earnings per Share
The price-to-earnings ratio indicates investors’ willingness to pay for a share in exchange for receiving a portion of the annual earnings.
C- Dividend Payout Ratio
How to calculate the ratio: Dividends Distributed to Shareholders / Net Profit
The dividend payout ratio measures the portion of a company's profits distributed to shareholders.
D- Holding Return Ratio
How to calculate the ratio: (Market Value of the Share at the End of the Period – Market Value of the Share at the Beginning of the Period + Share of Dividends Distributed) / Market Value of the Share at the Beginning of the Period
The holding return ratio indicates the gain achieved by the shareholder from holding the share during each financial period.
E- Return on Investment (ROI) in the Share
How to calculate the ratio: (Selling Price of the Share – Purchase Price of the Share + Share of Dividends Distributed) / Purchase Price of the Share
The return on investment in the share ratio measures the potential return for a shareholder who invests in the company.
Use the compound return calculator to analyze your investment returns for free automatically.
F- Market Value to Book Value Ratio
How to calculate the ratio: Market Price per Share / Book Value per Share
The market-to-book ratio reflects the investor's assessment of the company’s performance and position
Financial ratios are essential tools for analyzing a company’s financial performance and are divided into five main categories. Liquidity ratios measure the company’s ability to pay its short-term obligations using its current assets. Profitability ratios indicate how efficiently the company generates profits from its operations.
Activity (Efficiency) ratios focus on how effectively assets are used to generate revenue and convert it into cash. Meanwhile, debt (leverage) ratios assess the company’s reliance on debt financing and its ability to meet financial obligations. Finally, market ratios show how investors evaluate the company’s performance and the stock’s market value.
How are financial ratios used?
After evaluating a company’s financial position and obtaining its financial ratios, they are compared with those of other companies or possibly with the same company over past periods. It is important to note that such comparisons cannot be made without established standards or benchmarks. The following are the primary methods for evaluating financial ratios:
1- Horizontal Analysis (Trend Analysis)
This analysis involves comparing financial ratios obtained over several periods to identify a specific trend, which helps understand changes over time and ultimately derive interpretations and conclusions about these changes.
This type of analysis helps evaluate the company’s performance, determine whether the policies followed are suitable for achieving company goals, identify whether corrective actions are needed to change a policy or position, and predict the company’s future condition.
2- Vertical Analysis
This involves comparing two or more items within a financial statement over a specific period, such as inventory or assets, within the same accounting period. This comparison reveals the relative relationship between these items.
3- Comparison with Other Companies
The company’s ratios are compared with those of other local or international companies to evaluate its performance and position. This comparison can be based on different criteria, such as:
- Similarity basis: Comparing the company with other companies most similar to it in various aspects.
- Best practice basis: Selecting the best-performing companies as benchmarks for comparison.
4- Comparison with Industry Averages
Some authorities, such as chambers of commerce, industrial associations, and financial institutions, issue certain financial averages to evaluate the performance of a particular industry. The company’s ratios are then compared to these averages, noting that these averages indicate satisfactory performance rather than optimal performance. Therefore, the higher the ratio above the average, the better the company’s performance and position.
Financial ratio analysis methods include four approaches: horizontal analysis, which shows changes in ratios over multiple periods; vertical analysis, which compares elements within the same economic period.
Comparison with other companies based on similarity or best practices, and with industry averages from specialized authorities, which serve as indicators of acceptable market performance. These methods help interpret financial ratio results and accurately assess the company’s performance.
What are the Advantages and Disadvantages of Financial Ratio Analysis?
Financial ratio analysis is one of the most common tools for evaluating a company’s financial performance, as it provides information to support informed financial decisions. Despite its benefits, it has certain aspects that may limit its accuracy or usefulness in some cases.
What are the Advantages of Financial Ratio Analysis?
Financial ratio analysis helps understand a company’s financial position. Its advantages include:
- Evaluating Financial Performance: The ability to assess the company’s performance and position over a specific period and determine its profit and loss ratios.
- Analyzing the Company’s Position: Comparing the company with other companies in the same industry or sector, and based on that, investigating the company’s situation.
- Identifying Financial Risks: Helping evaluate potential financial risks reflected by the debt-to-asset ratio.
- Financial Planning: Improving future financial planning by applying practical strategies based on accurate and logical financial ratios.
- Measuring Operational Efficiency: Financial ratio analysis assesses operational efficiency by examining ratios related to sales and costs.
What are the Disadvantages of Financial Ratio Analysis?
Nothing is without disadvantages. The disadvantages of financial ratio analysis include:
- Inaccuracy in Comparison: When comparing ratios over long periods, the comparison may be inaccurate due to differences in conditions and procedures across periods, such as the adoption of new methods and procedures.
- Unfair Comparison: Privileges granted to some companies can make comparisons between the company and its peers unfair.
- Influence of External Factors: Financial ratios can be affected by external factors, including market changes.
- Difficulty in Comparing Companies: Variations in the standards companies use when applying ratio analysis make it difficult to compare performance across companies.
The advantages of financial ratio analysis include its effectiveness in evaluating financial performance, assessing the company’s position, identifying risks, supporting financial planning, and measuring operational efficiency.
On the other hand, ratio analysis faces challenges. One of them is inaccuracy in cross-time comparisons, unfair comparisons between companies, external factors, and inconsistent standards across companies, which may affect the analysis's credibility and effectiveness.
How does Daftra help you calculate financial ratios?
Financial ratios are among the most important tools in financial analysis, on which many high-stakes decisions are based. Through Daftra accounting software, you can easily calculate various financial ratios.
For example, by comparing current assets with current liabilities, you can calculate the liquidity ratio. By comparing profits with sales, you can easily calculate the profitability ratio. Similarly, dividing net sales by average total assets yields the activity ratio.
Frequently Asked Questions
What factors affect financial ratios?
- The accounting policies followed in recognizing revenues and expenses.
- Operational risks related to production and distribution certainly affect financial ratios and financial performance.
- Changes in consumer demand, which in turn affect sales volume and revenue, thereby impacting financial ratios.
- Investment decisions across asset types are among the most important factors affecting financial ratios, particularly liquidity and profitability ratios.
- The company's ability to manage and control costs.
How are financial ratios used correctly?
Financial ratios are used effectively to compare results across companies in the same industry. One should not rely on a single ratio but instead use multiple financial ratios, such as profitability, liquidity, leverage, and activity ratios, to get a comprehensive picture.
Can financial ratios alone be relied upon to assess financial performance?
No. It is recommended to support financial ratio results with financial statements to obtain a more accurate and reliable assessment. In addition, consider economic indicators such as interest rates, inflation, and economic recession, and study competitors and market trends, while accounting for factors that affect financial ratio results.
What financial ratios are most important for small businesses?
The most important financial ratios for small businesses are those that assess their ability to meet obligations and generate profits, such as profitability and quick liquidity ratios.
Are financial ratios similar between companies in the same sector?
Financial ratio results often vary even among companies in the same sector or industry, depending on company size, growth rate, and strategies.
What are financial structure ratios?
Financial ratios, or financial structure ratios, are used in financial analysis to evaluate a company’s financial position.
What are the objectives of financial ratios?
Financial ratios assess a company's financial performance, its ability to manage resources and meet obligations, and its strengths and weaknesses, and help investors and lenders make decisions based on accurate data.
How are financial statements analyzed?
Financial statements are analyzed using horizontal analysis to identify changes over time, vertical analysis to compare financial elements within the same period, and comparisons with other companies or industry averages.
What are profitability ratios?
Profitability ratios indicate the profits a company generates from its activities and projects. There are several ratios to measure company profitability:
- Gross Profit Ratio: Gross Profit / Sales
- Net Profit Ratio: Net Profit / Net Sales
- Return on Assets(ROA): Net Profit / Average Assets
- Net Profit on Capital: Net Profit / Working Capital
- Return on Equity (ROE): Net Profit / Average Shareholders’ Equity
- Earnings per Share (EPS): Net Profit / Average Number of Shares Outstanding
What are market ratios?
Market ratios show the market evaluation of a company’s performance, including:
- Earnings per Share (EPS) = Net Profit ÷ Average Number of Shares
- Price-to-Earnings (P/E) Ratio = Market Price per Share ÷ Earnings per Share
- Dividend Payout Ratio = Dividends ÷ Net Profit
- Retention Yield = (Ending Price + Share of Dividends – Beginning Price) ÷ Beginning Price
- Return on Investment in Shares = (Selling Price – Purchase Price + Share of Dividends) ÷ Purchase Price
- Market-to-Book Value Ratio = Market Value ÷ Book Value per Share
What are operating ratios?
Operating ratios, also called activity ratios, measure a company's efficiency in using its resources. They include:
- Asset Turnover Ratio = Net Sales ÷ Average Total Assets
- Working Capital Turnover = Net Sales ÷ Average Working Capital
- Average Credit Period = 365 ÷ Working Capital Turnover
- Accounts Receivable Turnover = Net Credit Sales ÷ Average Receivables
- Average Collection Period = 365 ÷ Accounts Receivable Turnover
- Inventory Turnover = Cost of Goods Sold ÷ Average Inventory
- Average Inventory Holding Period = 365 ÷ Inventory Turnover
- Operating Cycle = Average Collection Period + Average Inventory Holding Period
- Cash Cycle = Operating Cycle – Average Credit Period
What are liquidity ratios?
Liquidity ratios determine a company’s ability to meet its obligations. Types include:
- Current Ratio = Current Assets ÷ Current Liabilities
- Cash Ratio = Cash and Equivalents ÷ Current Liabilities
- Quick Ratio = (Current Assets – Inventory) ÷ (Prepaid Expenses – Current Liabilities)
- Net Working Capital = Current Assets – Current Liabilities
- Operating Cash Flow Ratio = Operating Cash Flow ÷ Current Liabilities
- Cash Coverage Ratio = (Current Assets – Inventory – Prepaid Expenses) ÷ Daily Operating Expenses
How do I calculate liquidity ratios?
Liquidity ratios vary, and each has a different calculation:
- Current Ratio = Current Assets ÷ Current Liabilities
- Cash Ratio = Cash and Equivalents ÷ Current Liabilities
- Quick Ratio = (Current Assets – Inventory) ÷ (Prepaid Expenses – Current Liabilities)
- Net Working Capital = Current Assets – Current Liabilities
- Operating Cash Flow Ratio = Operating Cash Flow ÷ Current Liabilities
- Cash Coverage Ratio = (Current Assets – Inventory – Prepaid Expenses) ÷ Daily Operating Expenses
What is the debt-to-asset ratio?
The debt-to-asset ratio measures the company’s reliance on debt financing and is calculated as:
Debt-to-Asset Ratio = Total Debt ÷ Total Assets
How is the coverage ratio calculated?
The cash coverage ratio is calculated as:
Cash Coverage Ratio = (Current Assets – Inventory – Prepaid Expenses) ÷ Daily Operating Expenses
What are debt ratios in financial analysis?
Debt ratios determine the company’s reliance on debt to finance assets. Types include:
- Debt-to-Total Assets Ratio: Shows reliance on debt to finance assets.
- Debt-to-Equity Ratio: Indicates the relationship between debt and equity financing.
- Debt-to-Shareholders’ Equity Ratio: Shows the extent of asset financing through loans relative to shareholders’ equity.
- Interest Coverage Ratio: Measures the company’s ability to pay interest on its debts on time.
What is horizontal analysis of financial statements?
Horizontal analysis compares financial ratios over multiple periods to identify trends and changes in company performance.
What is the difference between vertical and horizontal analysis?
Horizontal analysis compares ratios across multiple periods to identify changes, while vertical analysis compares elements within the same financial period.
How can I calculate the financial solvency ratio?
The financial solvency ratio shows a company’s ability to meet long-term obligations and is calculated as:
Financial Solvency Ratio = Total Assets ÷ Total Liabilities
How is the financial independence ratio calculated?
The financial independence ratio indicates a company’s ability to meet obligations using its own funds rather than external financing:
Financial Independence Ratio = Total Equity (Capital + Reserves) ÷ Total Debt
How can I calculate the cash ratio?
The cash ratio refers to cash liquidity and is calculated as:
Cash Ratio = Cash and Equivalents ÷ Current Liabilities
How can I calculate the debt ratio?
Debt ratios are calculated according to the type of ratio:
- Debt-to-Total Assets = Total Debt ÷ Total Assets
- Debt-to-Equity = Total Debt ÷ Equity
- Debt-to-Shareholders’ Equity = Total Debt ÷ Total Shareholders’ Equity
- Interest Coverage = Earnings Before Interest and Taxes ÷ Total Interest Expense
What are activity ratios in financial analysis?
Activity ratios measure how efficiently a company uses its resources, in other words, its ability to generate sales from its assets.
What is the price-to-earnings ratio?
The price-to-earnings ratio expresses the relationship between a company’s share price and its earnings per share, calculated as:
Price-to-Earnings (P/E) Ratio = Market Price per Share ÷ Earnings per Share
Conclusion
In conclusion, a detailed explanation demonstrates that financial analysis is helpful for companies and business owners, and ratio analysis is one of the most common tools. Everything has advantages and disadvantages, including accounting methods.
Ratio analysis has many types and branches, with rules and steps governing its use. This article discusses them in detail, covering all key aspects to help anyone apply financial ratios.