


Posted on 16 November 2026
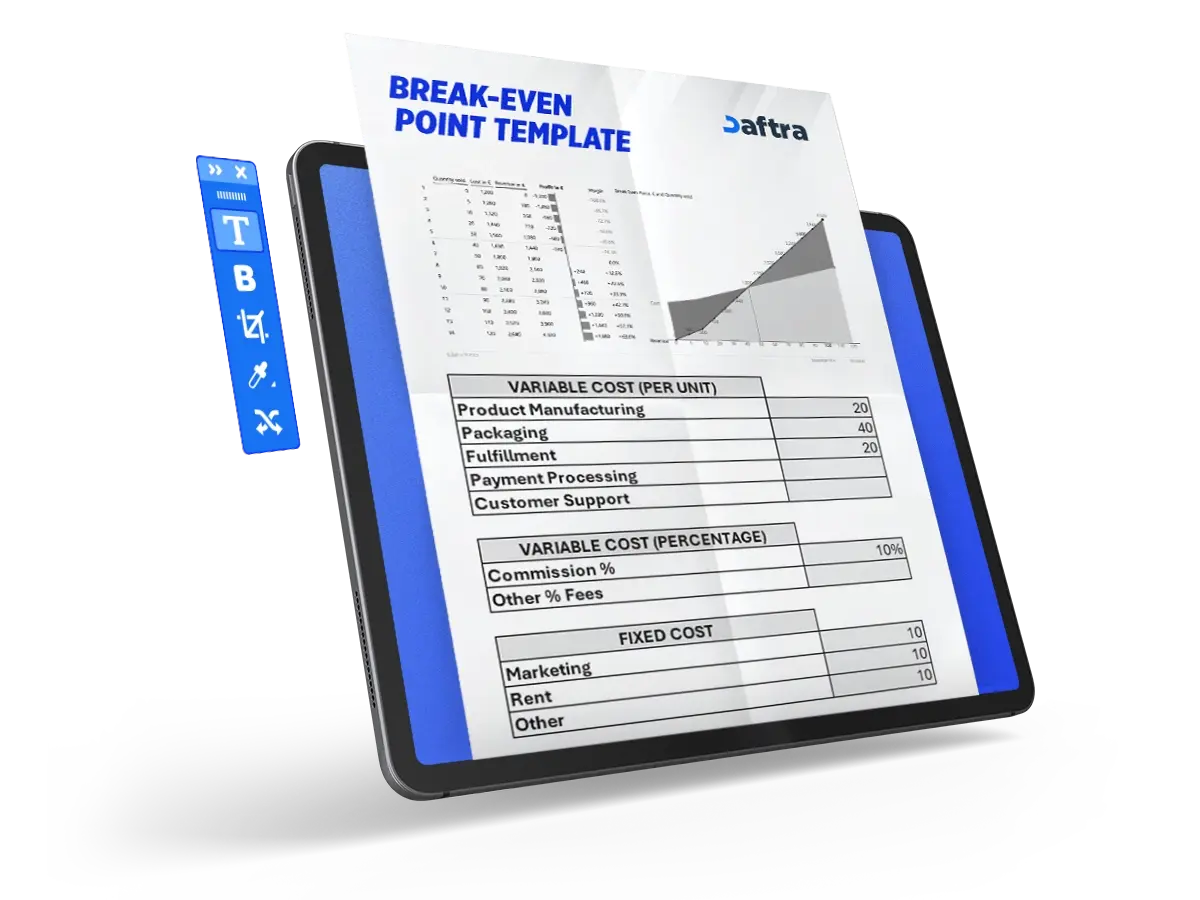
Break-Even Point Template
- A Break-Even Point Template helps determine the number of units a company needs to sell to generate revenue that covers the total fixed and variable costs of the project or production line.
- The template addresses more than one method for identifying the break-even point. The first is the trial-and-error method, while the other uses a graph to obtain this value.
- A Break-Even Point Template helps achieve greater profitability and makes feasibility studies more effective, which in turn makes product pricing more accurate.


 Make Smarter Financial Decisions with Daftra
What Is a Break-Even Point Template?
A Break-Even Point Template is a model that helps you identify the point at which total costs and revenue are equal, allowing you to estimate the target revenue and predict the period in which you can achieve it. The template presents two methods for calculating the break-even point—trial and error or a graph—and both methods are valid and lead to the correct break-even point.
Why Is a Break-Even Point Template Important?
The importance of a Break-Even Point Template can be seen in several areas, as follows:
- It helps your company determine whether the expenses it incurs are generating a suitable return. A Break-Even Point Template helps identify the value at which costs match revenue.
- It guides your company toward the variable and burdensome costs that affect performance, helping reduce expenses that slow down reaching the break-even point.
- It alerts the company to fair pricing that generates profit while remaining aligned with the market and cost requirements.
What Are the Elements of a Break-Even Point Template?
When applying the Trial and Error method, the Break-Even Point Template works with essential elements that should be included, as follows:
1- Number of Units
A Break-Even Point Template includes products or services in units. This means that a certain number of units of product or service X should ultimately be enough to cover the costs.
2- Unit Price
The template should include the unit price so that the number of units can be multiplied by the unit price in order to calculate total revenue.
3- Fixed Cost
These are the fixed costs the company incurs monthly or annually, regardless of the nature or volume of the work, and they include rent, salaries, and similar items.
4- Variable Cost
These are costs that depend on the company's situation, such as projects, clients, contracts, and other changing business conditions.
5- Net Profit or Loss
This is the result of subtracting costs from revenue. If the result is positive, it is a profit; if it is negative, it is a loss.
When using the graphing method, the template works with three main elements:
- The horizontal axis includes the number of units of products sold, which may be shown in thousands, hundreds, or another relevant quantity scale.
- The vertical axis includes total cost, consisting of fixed cost plus variable cost, together with revenue.
You May Also Download
Profit Margin Calculation Template
Product Cost Calculation Template
Ready-to-Use Financial Plan Template
How Can You Use a Break-Even Point Template?
You can use the template easily through the following steps to determine the break-even point.
Using the Trial and Error Method
1- Calculate the appropriate unit cost
Is your production or distribution measured by a single unit or by a group of units? You should determine whether production is measured by the thousand, the hundred, or by the individual unit so that cost can be calculated easily. For example, if producing one unit costs the company one dollar, then the costing basis should be at least 100 units, which equals 100 dollars, making the values easier and faster to work with.
2- Determine the time period for each production batch
What is the annual production volume? Is it fixed or variable? If it is variable, then the average number should be used. If we assume annual production is 100,000 units, then the variable cost is 1,000 dollars. Next, add the fixed cost and assume it is $ 150,000. In this way, the total cost becomes 250,000 dollars in one year.
3- Determine the unit selling price
What if the unit is sold for only two dollars? In that case, total annual revenue would become 200,000 US dollars.
4- Calculate the net result
Subtract costs from profits in order to obtain the net profit or loss.
5- Repeat the process
Repeat the process until you reach the break-even point, where costs and revenue are equal.
The year in which break-even occurs can be determined using the following formula:
N = Fixed Cost / (Selling Price − Variable Cost)
If the selling price is 2 dollars, the variable cost is 1,000 dollars per year, and the fixed cost is 3,000 dollars, then the break-even point is expected to occur in the third year, since:
3000 / (2000 − 1000) = 3, which means after 3 years from the start of the project.
Using the Graphing Method
When using the graphing method, the following steps can be followed:
1- Determine the values of the horizontal axis
The horizontal axis includes only one type of data: the number of units produced.
2- Determine the values of the vertical axis
The vertical axis includes two types of data: unit cost and revenue.
3- Begin plotting the points
Draw two straight-line curves, each representing a linear relationship. The first curve shows the relationship between unit cost (vertical axis) and the number of units (horizontal axis). The second curve shows the relationship between revenue and the number of units.
4- Identify the intersection point
To determine the break-even point, indicate the point where the two curves intersect on the graph.
Who Benefits from a Break-Even Point Template?
Many parties benefit from this template, most notably financiers and partners. The closer the break-even point is, the greater the investor’s confidence becomes, and the faster the decision-making process can be.






 Invoicing
 POS
 Offers
 Installments
 Sales Commission
 KSA E-Invoice Software
 EGY E-Invoice Software
 JO E-Invoice Software
 E-Invoice Software
 Chart of Accounts
 Asset Management
 Cost Centers
 Expenses
 Cheque Cycle
 VAT & Tax Compliance
 Product Management
 Purchases
 Purchase Cycle
 Suppliers
 Requisitions
 Stocktaking
 Organizational Structure
 Personnel Management
 Attendance and Leave
 Contracts
 Payroll
 Requests
 Work Orders
 Booking Management
 Rental and Unit Management
 Time Tracking
 Work Flow
 Lease Contracts
 Manufacturing Management
 Client Follow-Up
 Loyalty Points
 Points and Credits
 Memberships
 Insurance Management
 Daftra ERP Full App
 Point of Sales App
 Point of Sales for Desktop – Support Offline Mode
 AI Expenses Scanner App
 Employee Attendance, Sign & ESS App
 E-invoice Reader App
 Inventory Stocktaking App